
?")
The Dow Jones Industrial Average stands as one of the most recognized barometers of the U.S. stock market. But what exactly is it, and why does it matter to investors worldwide?
The DJIA tracks 30 of America’s largest and most established publicly traded companies, offering a snapshot of how the U.S. economy is performing. Created in 1896 by Charles Dow and Edward Jones, this price-weighted index has evolved from tracking primarily industrial companies to representing diverse sectors of the modern economy.
Understanding how the Dow works, what it measures, and its limitations can help you make more informed investment decisions and better interpret market news. This comprehensive guide breaks down everything you need to know about the DJIA.
Table of Contents
Understanding the Dow Jones Industrial Average
The Dow Jones Industrial Average represents more than just 30 stock prices—it’s a carefully constructed index designed to reflect the health of the U.S. economy. Unlike market-cap-weighted indices like the S&P 500, the DJIA uses a price-weighted methodology that gives higher-priced stocks greater influence on the index’s movements.

The Origins and Evolution
Charles Dow and Edward Jones launched the DJIA in May 1896 with just 12 companies, primarily from industrial sectors like railroads, cotton, gas, sugar, tobacco, and oil. The index reflected the economic reality of late 19th-century America, when manufacturing and commodities dominated the business landscape.
By 1928, the index expanded to 30 components—a number that has remained constant ever since. However, the composition has changed dramatically. Today’s DJIA includes technology giants like NVIDIA Corporation and Microsoft, healthcare leaders, financial services firms, and consumer brands—a far cry from its industrial roots.
S&P Dow Jones Indices now manages the DJIA, regularly evaluating companies for inclusion based on their reputation, sustained growth, and representation of the American economy. For those interested in understanding business fundamentals, studying the Dow’s evolution offers valuable insights into how economies transform over time.
How the Dow Divisor Works
The Dow’s calculation method sets it apart from other major indices. Rather than using a simple arithmetic average, the DJIA employs a “Dow Divisor”—a constant that adjusts for corporate actions like stock splits, spinoffs, and component changes.
Here’s how it works: You add up the share prices of all 30 component stocks and divide by the Dow Divisor. As of 2024, this divisor is approximately 0.15265312230608, a far cry from the original divisor of 30 when the index launched.
Why such a small number? Over the decades, numerous stock splits and corporate restructurings have occurred. Without the divisor adjustment, these events would artificially distort the index value. The divisor ensures continuity, allowing today’s DJIA to be historically comparable to past values.
This means a one-point move in any component stock produces an identical point change in the index, regardless of the company’s total market value. This price-weighted approach has both advantages and drawbacks, which we’ll explore later.
DJIA Components and Selection Criteria
The 30 companies comprising the Dow Jones Industrial Average represent America’s blue-chip stocks—established, financially sound corporations with histories of reliable performance. But how do companies earn a spot in this exclusive club?
The Selection Process
Unlike the S&P 500, which follows a rules-based formula for inclusion, the DJIA relies on a committee from S&P Dow Jones Indices. This committee evaluates potential additions based on several factors:
- Reputation and growth trajectory: Companies must demonstrate sustained growth and maintain excellent reputations in their industries.
- Economic representation: The index aims to reflect the diverse sectors of the U.S. economy, from technology and healthcare to consumer goods and finance.
- Trading venue: All components must be listed on either the New York Stock Exchange (NYSE) or Nasdaq.
- Liquidity and stability: Companies must have sufficient trading volume and financial stability to justify inclusion.
This subjective approach allows for thoughtful curation but also means changes happen relatively infrequently. Since 1896, there have been only 53 adjustments to the index composition.
Recent Component Changes
The DJIA’s composition evolves to mirror economic shifts. Several notable changes in recent years highlight this evolution:
In February 2024, Amazon.com Inc. replaced Walgreens Boots Alliance after Walmart’s stock split reduced its index weighting. This swap reflected the growing dominance of e-commerce over traditional retail pharmacy.
The most significant recent change came in November 2024 when NVIDIA Corporation replaced Intel Corporation. This historic shift acknowledged NVIDIA’s explosive growth in the semiconductor sector, particularly driven by advances in artificial intelligence technology. Meanwhile, Sherwin-Williams replaced Dow Inc., reflecting stronger performance in the coatings industry.
These changes demonstrate the committee’s willingness to adapt the index to represent modern economic realities. For entrepreneurs exploring digital transformation strategies, understanding which companies lead the Dow offers insights into which sectors drive growth.
Historical Milestones of the DJIA
The Dow’s journey through American economic history includes dramatic peaks, devastating crashes, and steady recoveries that mirror the nation’s financial evolution.
Major Market Moments
The Great Depression Era: On March 15, 1933, the DJIA posted its largest single-day percentage gain ever—15.34%—climbing 8.26 points to close at 62.10. This surge came during one of the darkest periods in American economic history, offering a glimmer of hope during the Depression.
Black Monday: October 19, 1987 saw the index’s worst single-day percentage drop when it plummeted 22.61%. Despite no clear explanation for the crash, program trading likely contributed to the panic selling.
Post-9/11 Response: When markets reopened on September 17, 2001, the Dow dropped 684.81 points—about 7.1%—representing the fourth-largest point drop at that time. However, the index had already been declining since early January, and it recovered within months, demonstrating market resilience.
Milestone Achievements
The DJIA has crossed numerous psychological barriers throughout its history:
- 15,000: First reached on May 3, 2013
- 20,000: Surpassed on January 25, 2017
- 25,000: Crossed on January 4, 2018
- 26,000: Hit just 13 days later on January 17, 2018
- 30,000: Broken on November 24, 2020
- 35,000: Traded above this level in July 2021
- 40,000: Surpassed for the first time on May 16, 2024
The COVID-19 pandemic created unprecedented volatility. In March 2020, the index crashed below 20,000, officially entering bear market territory and ending the longest bull market in history that began in March 2009. By November 2020, it had recovered to new highs, demonstrating remarkable resilience.
For those tracking market trends over 180 days, understanding these historical patterns provides valuable context for interpreting current movements.
How to Invest in the Dow Jones
Individual investors cannot directly invest in the DJIA itself—it’s an index, not a security. However, several investment vehicles provide exposure to all 30 Dow components simultaneously.
Index Funds and ETFs
The most straightforward way to gain Dow exposure is through exchange-traded funds (ETFs) that track the index. The SPDR Dow Jones Industrial Average ETF (DIA) is the most popular option, offering:
- Diversification: Instant exposure to all 30 blue-chip companies
- Liquidity: Easy to buy and sell during market hours
- Low costs: Minimal management fees compared to actively managed funds
- Transparency: Holdings mirror the DJIA exactly
Other investment options include mutual funds that track the Dow or derivative products like futures and options contracts. For beginners exploring small business ideas alongside investing, starting with broad index funds provides market exposure while you build other income streams.
DJIA Chart Analysis and Market Indicators
Reading Dow Jones charts helps investors identify trends, potential turning points, and overall market sentiment. The DJIA chart today reflects real-time pricing during market hours (9:30 AM to 4:00 PM ET), while DJIA futures trading provides insight into market expectations before the opening bell.
Key Chart Elements
Price Action: The DJIA stock price moves throughout each trading session based on the collective price movements of its 30 components. Technical analysts study these movements to identify patterns and trends.
Volume: Trading volume indicates the strength behind price movements. High volume during price increases suggests strong buying conviction, while high volume during declines may signal panic selling.
Moving Averages: Many analysts watch the 50-day and 200-day moving averages. When the index trades above these levels, it’s generally considered bullish; below them is bearish.
Support and Resistance: Historical price levels where the index has repeatedly bounced (support) or stalled (resistance) help traders make entry and exit decisions.
The DJIA ticker symbol (^DJI) allows investors to track real-time performance across financial platforms. DJIA live updates during market hours provide immediate feedback on how America’s largest companies are performing.
Comparing the DJIA to Other Major Indices
Understanding how the Dow Jones differs from other indices helps investors choose appropriate benchmarks and investment vehicles.
DJIA vs. S&P 500
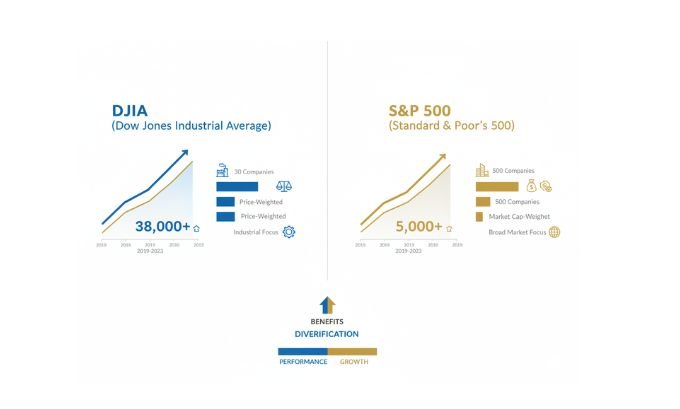
The S&P 500 tracks 500 large-cap U.S. companies compared to the Dow’s 30. Key differences include:
| Feature | DJIA | S&P 500 |
|---|---|---|
| Number of Companies | 30 | 500 |
| Weighting Method | Price-weighted | Market-cap-weighted |
| Selection Process | Committee-based | Formula-based |
| Market Representation | Limited to 30 blue chips | Broader market coverage |
| Calculation Method | Dow Divisor | Base year comparison |
The S&P 500 has outperformed the DJIA on an annualized basis over the last three, five, and ten-year periods, partly due to its broader diversification and market-cap weighting methodology.
DJIA vs. Nasdaq Composite
While some DJIA components trade on Nasdaq, the Nasdaq Composite includes over 3,000 stocks and heavily weights technology companies. The Dow provides exposure to traditional blue chips across various sectors, while the Nasdaq offers greater tech concentration.
For those interested in scaling businesses successfully, understanding these index differences helps contextualize which sectors drive different market segments.
Limitations and Criticisms of the DJIA
Despite its iconic status, the Dow Jones Industrial Average faces valid criticisms from financial professionals and academics.
Price-Weighting Bias
The DJIA’s price-weighted methodology creates distortions. A $300 stock has ten times the influence of a $30 stock, regardless of company size or economic importance. This means a smaller company with a high stock price can impact the index more than a massive corporation with a lower share price.
For example, a 10% increase in a $200 stock moves the index far more than a 10% increase in a $50 stock, even if the latter company has much greater market capitalization and economic significance.
Limited Representation
With only 30 companies, the DJIA captures less than 1% of the thousands of stocks trading on U.S. exchanges. Critics argue this limited sample cannot accurately represent the entire U.S. economy or stock market performance.
The S&P 500’s 500 companies provide significantly broader coverage, while the Wilshire 5000 (despite its name, it actually tracks more stocks) attempts to represent the entire U.S. equity market.
Sector Concentration
The committee’s subjective selection process can lead to sector imbalances. At various times, the index has been overweight or underweight in critical economic sectors, potentially skewing its representation of overall market performance.
Ignores Market Capitalization
By focusing solely on stock prices, the DJIA ignores market capitalization—the total value of a company’s outstanding shares. Many financial professionals consider market cap a more meaningful measure of economic importance than share price, which is essentially arbitrary (companies can split or consolidate shares at will).
For business owners exploring effective marketing strategies, understanding these index limitations helps interpret market-related news coverage more critically.
The DJIA’s Role in Today’s Market
Despite its limitations, the Dow Jones Industrial Average remains highly relevant for several reasons.
Media and Public Perception
News outlets prominently feature DJIA movements in their financial coverage. When reporters say “the market was up today,” they’re often referencing the Dow. This widespread recognition makes it an important psychological barometer, even if more comprehensive indices better measure market performance.
Blue-Chip Benchmark
The DJIA specifically tracks America’s most established corporations—the blue-chip companies that form the backbone of many retirement portfolios. For conservative investors focused on stability, the Dow’s performance matters more than growth-oriented indices.

Historical Continuity
With data stretching back to 1896, the DJIA offers unparalleled historical perspective on American economic cycles, bull and bear markets, and long-term performance trends. This historical record remains valuable for research and context.
For entrepreneurs launching e-commerce businesses, tracking the Dow provides insight into consumer spending patterns reflected in retail component performance.
Frequently Asked Questions About the DJIA
What does DJIA stand for?
DJIA stands for Dow Jones Industrial Average. It’s also commonly called “the Dow” or “Dow 30.”
How is the DJIA calculated?
The DJIA is calculated by adding the stock prices of its 30 component companies and dividing by the Dow Divisor (currently approximately 0.1527). This price-weighted methodology means higher-priced stocks have greater influence on the index.
When does the DJIA trade?
The DJIA reflects trading activity during regular NYSE hours: 9:30 AM to 4:00 PM Eastern Time, Monday through Friday (excluding market holidays). DJIA futures trade nearly 24 hours a day, providing pre-market and after-hours price discovery.
What was the DJIA’s all-time high?
As of 2024, the DJIA has surpassed 40,000 points. The index continues reaching new highs as the U.S. economy and corporate earnings grow over time.
Can I invest directly in the DJIA?
No, you cannot invest directly in the index itself. However, you can invest in ETFs like the SPDR Dow Jones Industrial Average ETF (DIA) that track the index’s performance.
How often does the DJIA composition change?
Changes happen relatively infrequently—only 53 times since 1896. The committee evaluates potential changes based on economic representation, company performance, and market conditions.
Why did NVIDIA replace Intel in the DJIA?
In November 2024, NVIDIA replaced Intel to better reflect the semiconductor industry’s evolution. NVIDIA’s leadership in AI-driven chip technology and superior market performance made it a more representative choice for the index.
Making Informed Investment Decisions
The Dow Jones Industrial Average offers valuable insights into how America’s largest corporations are performing, but it shouldn’t be your only market reference. Consider these best practices:
Diversify Your Analysis: Don’t rely solely on the DJIA. Monitor the S&P 500 for broader market perspective and sector-specific indices for targeted insights.
Understand Context: A 300-point DJIA move means something different when the index is at 40,000 versus 20,000. Focus on percentage changes rather than point movements.
Consider Your Goals: If you’re investing for retirement decades away, short-term DJIA fluctuations matter far less than long-term trends and your overall asset allocation.
Stay Informed: The DJIA chart today, DJIA premarket activity, and futures pricing provide real-time market sentiment. Tools like LinkLuminous can help you track these indicators effectively.
Remember the Limitations: The DJIA’s 30 companies represent only a fraction of investment opportunities. Explore broader diversification through funds tracking the S&P 500, international indices, and alternative asset classes.
For those developing goal-setting strategies for their financial future, understanding major market indices forms an essential foundation for informed planning.
The DJIA’s Enduring Legacy
Since Charles Dow and Edward Jones created this groundbreaking index in 1896, the DJIA has witnessed every major economic event in modern American history—from the Roaring Twenties through the Great Depression, from post-war prosperity to the dot-com bubble, from the 2008 financial crisis to the COVID-19 pandemic recovery.
The index’s ability to adapt—replacing industrial giants like U.S. Steel with technology leaders like NVIDIA—demonstrates its ongoing relevance. While the S&P 500 may offer broader market representation, the Dow’s focus on 30 blue-chip companies provides a focused snapshot of America’s corporate elite.
Understanding the DJIA—its calculation methodology, component selection, historical significance, and limitations—equips you with essential knowledge for interpreting market news and making informed investment decisions. Whether you’re an experienced investor or just starting your financial journey, the Dow Jones Industrial Average remains an important piece of the market puzzle.